Predictive rental-market analytics · Warsaw
The direction of rents, before it hits the reports.
PropertyTrend reads real rental listings and shows where rents are rising or softening — 1–3 weeks ahead. No invented numbers: every metric has a source, a window and a sample.
Demo · real Warsaw data
Static reports arrive late
Quarterly studies describe a market from months ago. We watch supply and asking prices every day, so a change of direction is visible while you can still act on it.
How it works
Real listings, not reports
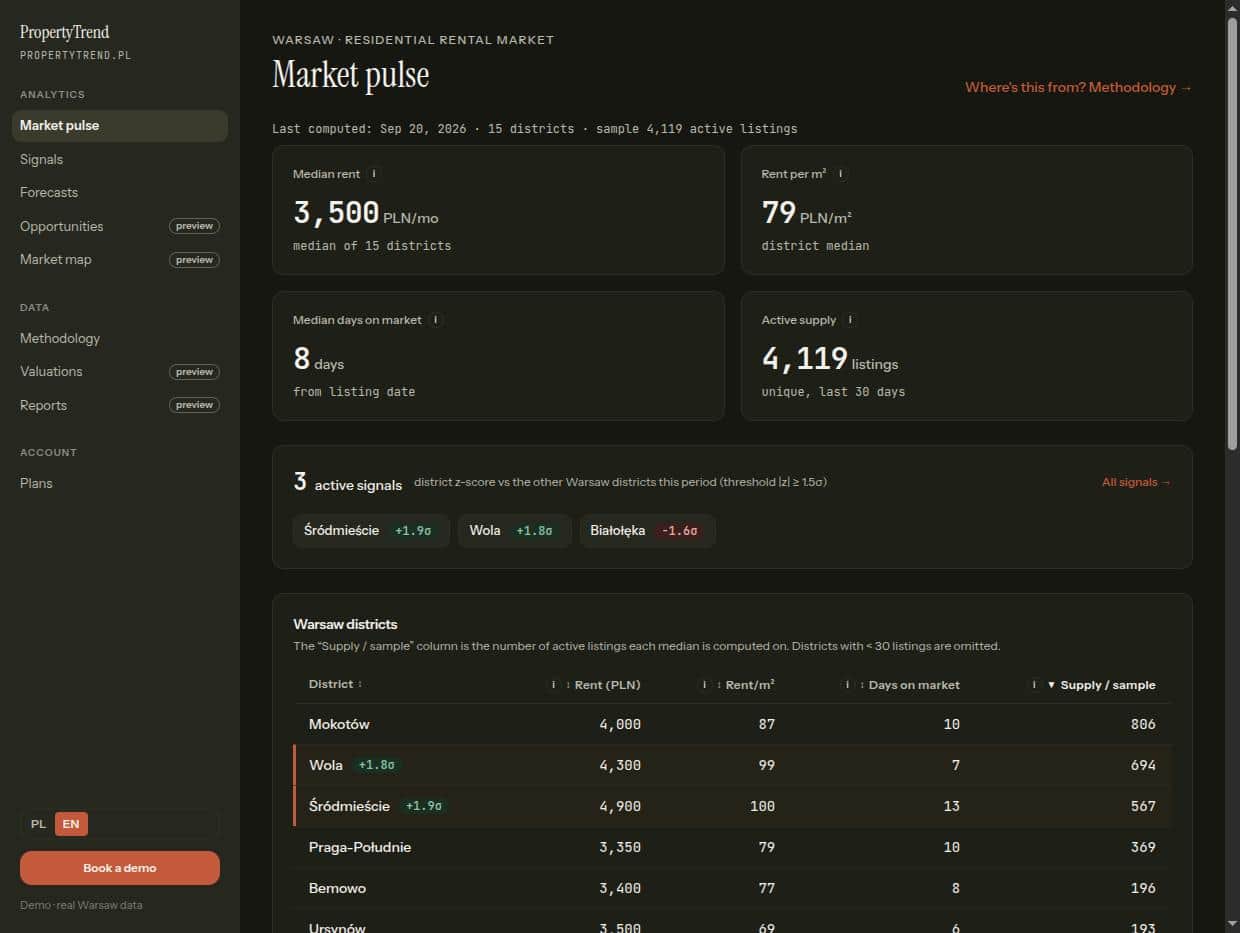
We collect rental listings from Otodom daily and compute per-district medians — rent, rent/m², days on market, supply.
Transparent method
Deduplication by listing id, a 30-day window, outlier trimming. Every number has a defined sample.
Forecast with error
A short-horizon rent forecast with a confidence band and published backtest error (MAPE/MAE) — we show the model's misses too.
Who it's for
Developers & BTR
Setting rents and lease-up pace for new schemes.
PRS operators
Monitoring supply and price pressure across a portfolio of districts.
Funds & banks
An independent, repeatable base for rental-risk pricing.
Insurers
Early signals of shifts in local rental markets.
Frequently asked questions
- Where does the data come from?
- From real Otodom rental listings, collected daily. District metrics and the forecast in this demo rely on Otodom only. Details in the methodology.
- Asking rents or transaction rents?
- Asking (from listings). We have no access to a rental-transaction registry, so we don't pretend to.
- How do you compute anomalies (+1.9σ)?
- It's a district's z-score versus the other Warsaw districts that period; a signal fires at |z| ≥ 1.5σ. Full description in the methodology.
- How far back does the history go?
- About half a year of listings — enough for multi-month trends and short-horizon forecasts, too short for year-on-year comparisons (which we don't show).